Construction, manufacturing, energy, and IT businesses rely on accurate project planning and execution to be successful. Primavera P6 is a powerful tool for project managers, but it can be difficult to get the most out of its capabilities without help from experts. Fortunately, Power BI can provide the insights you need to make the most of your Primavera data. Let’s take a look at how these two technologies can work together to improve your projects.
Introducing Primavera P6 and Power BI
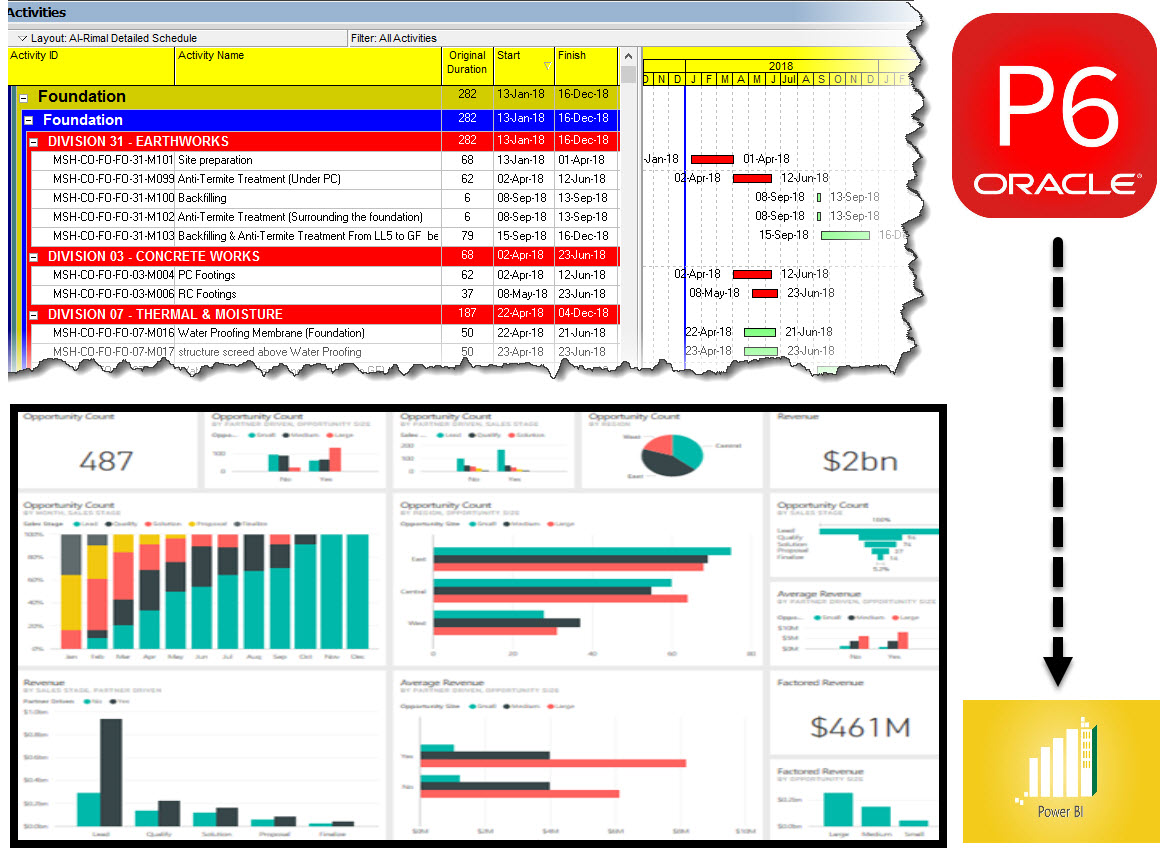
Primavera P6 is a construction management software application that enables users to schedule and track construction projects. The software is used by project managers and planners to create and monitor project schedules, resources, budgets, and risks. Power BI is a business intelligence tool that helps users to visualize and analyze data. The two tools can be used together to provide insights into construction projects. For example, Power BI can be used to create visualizations of project data that can be used to identify trends and areas for improvement. Primavera P6 can then be used to create detailed schedules and resources plans based on these insights. Together, these tools can help construction professionals to better manage their projects and improve their results.
What data can be extracted from Primavera P6 and analyzed in Power BI?
Power BI is a Microsoft business analytics tool that can be used to extract data from various sources in order to create interactive visualizations and reports. One such data source is Primavera P6, a construction project management software. By connecting Power BI to Primavera P6, users can gain insights into their construction projects that would otherwise be unavailable. For example, Power BI can be used to track the progress of individual tasks, identify bottlenecks in the project timeline, and predict when the project will be completed. In addition, Power BI can also be used to monitor resource usage and identify areas where cost savings can be achieved. By harnessing the power of Power BI, construction managers can gain a better understanding of their projects and make more informed decisions.
How to create reports and dashboards with Primavera P6 data in Power BI
The first step is to connect to your Primavera P6 database using the Power BI Desktop application. Once you have connected to the database, you will be able to select the data that you want to include in your report or dashboard.
Once you have selected the data, you can then start to create your visualizations. Power BI provides a wide range of visualization options, so you can tailor your reports and dashboards to meet your specific needs. For example, you could create a bar chart to track project progress, or a pie chart to compare costs across different project phases.
Once you have created your visualizations, you can then publish your reports and dashboards to the Power BI service, where they can be shared with others in your organization. Publishing to the Power BI service also allows you to take advantage of features such as scheduled refresh, which ensures that your reports and dashboards are always up-to-date with the latest data from Primavera P6.
Tips and tricks for getting the most out of Primavera P6 and Power BI Integration
Here are some tips and tricks for getting the most out of Primavera P6 and Power BI:
- Use Power BI to create custom reports for your Primavera P6 data. This way, you can easily visualize important information and identify trends.
- Take advantage of the Data Model Explorer in Power BI to better understand the relationships between different data sets.
- Use the Query Editor in Power BI to transform and cleanse your data before creating reports or dashboards.
- Use conditional formatting in Power BI to highlight key data points or visually flag issues.
By following these tips, you can get the most out of Primavera P6 and Power BI. With these tools at your disposal, you’ll be able to manage your projects more effectively and make better decisions for your business.
So, there you have it- a quick introduction to Primavera P6 and Power BI. I hope this has given you some ideas about the kinds of reports and dashboards you can create with data from your projects in Primavera P6. In future posts, we’ll explore more specific topics related to working with Primavera data in Power BI, so stay tuned! If you have any questions or comments on this topic, please let me know in the comments below.